
Case Study
Case Study
An annual intra-comparison between two oil calibrations and one water calibration at TÜV SÜD National Engineering Laboratory was conducted to provide confidence in the calibration and measurement capabilities of the facility.
TÜV SÜD National Engineering Laboratory has three single phase liquid facilities - Oil, Water, and Elevated Pressure and Temperature (EPAT), which are accredited to ISO 17025 by United Kingdom Accreditation Service (UKAS Accredited Calibration Laboratory No. 0009).
Care must be taken to conduct a valid and thorough intra-comparison. This ensures the results are valid, the comparison of data has been analysed correctly, and prevents misleading or inconclusive results.
When it comes to completing the intra-comparison between facilities, care must be taken with analysis of results. With reference to the comparison undertaken, the following areas were given close consideration:
Two different flow meters, a Coriolis and Venturi tube, were installed in series and used as the comparison Transfer Standard Device (TSD). The Coriolis flow meter is a mass meter so three target mass flow rates were used across all tests for comparison.
For the Venturi tube, the equations governing the flow device incorporate a density term. Therefore, due to the variation in density across the test facilities, target Reynolds Numbers were used in the comparison. This allows for both measurements of flow in mass and volume to be made. The set-up in one facility is shown in Figure 1.
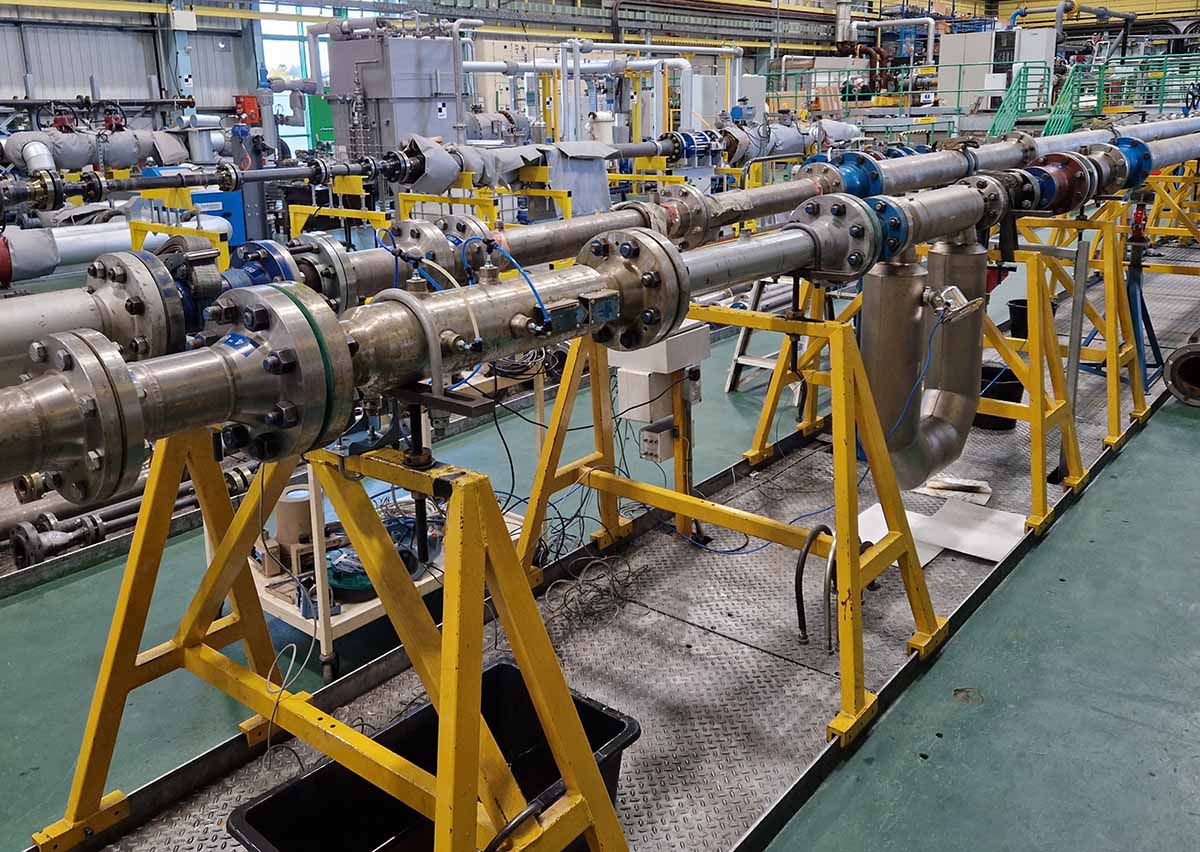
Figure 1: Venturi tube and Coriolis meter fitted in series
The oil and water tests were completed at 2 bar(g). However, the EPAT test was conducted at the slightly higher pressure of 5 bar(g). The Coriolis meter used in the TSD has a known pressure effect, and to correct for this, a previously derived pressure compensation factor was applied [1].
The total expanded uncertainty estimates were calculated for both the Coriolis meter and Venturi tube, for each group of test points.
To allow for comparison of the tests, a weighted mean average approach was used to calculate the equivalence of the results. This follows an international standard approach [2][3][4][5][6][7][8].
Equivalence (En) was then calculated from the ratio of the difference of the measured performance indicator weighted to the difference from the weighted uncertainty to calculated uncertainty for each test point group.
The results taken, averaged for each group of 3 repeats, are displayed in Figure 2 for the Coriolis flow meter. The expanded absolute uncertainties in the k-factor (pulse/kg) are shown on the plot for each group as an error bar. Three mass flow rates were utilised in the comparison each comprising of 3 repeats. The En value is less than 1 for all results and therefore equivalence within the 95% confidence across the three facilities can be stated through the Coriolis meter.

Figure 2: 3-inch Coriolis K-Factor Performance Indicator Comparison across Single Phase Liquid Calibration Facilities at TÜV SÜD
The results taken, averaged for each group of 3 repeats, are displayed in Figure 3 for the Venturi tube. The expanded absolute uncertainties shown on the plot for each group as an error bar, with the discharge coefficient used as the performance indicator. The En value is less than 1 for all three sets of data points, with Reynolds numbers close enough for comparison and therefore equivalence within the 95% confidence across the three facilities can be stated through the Venturi tube.
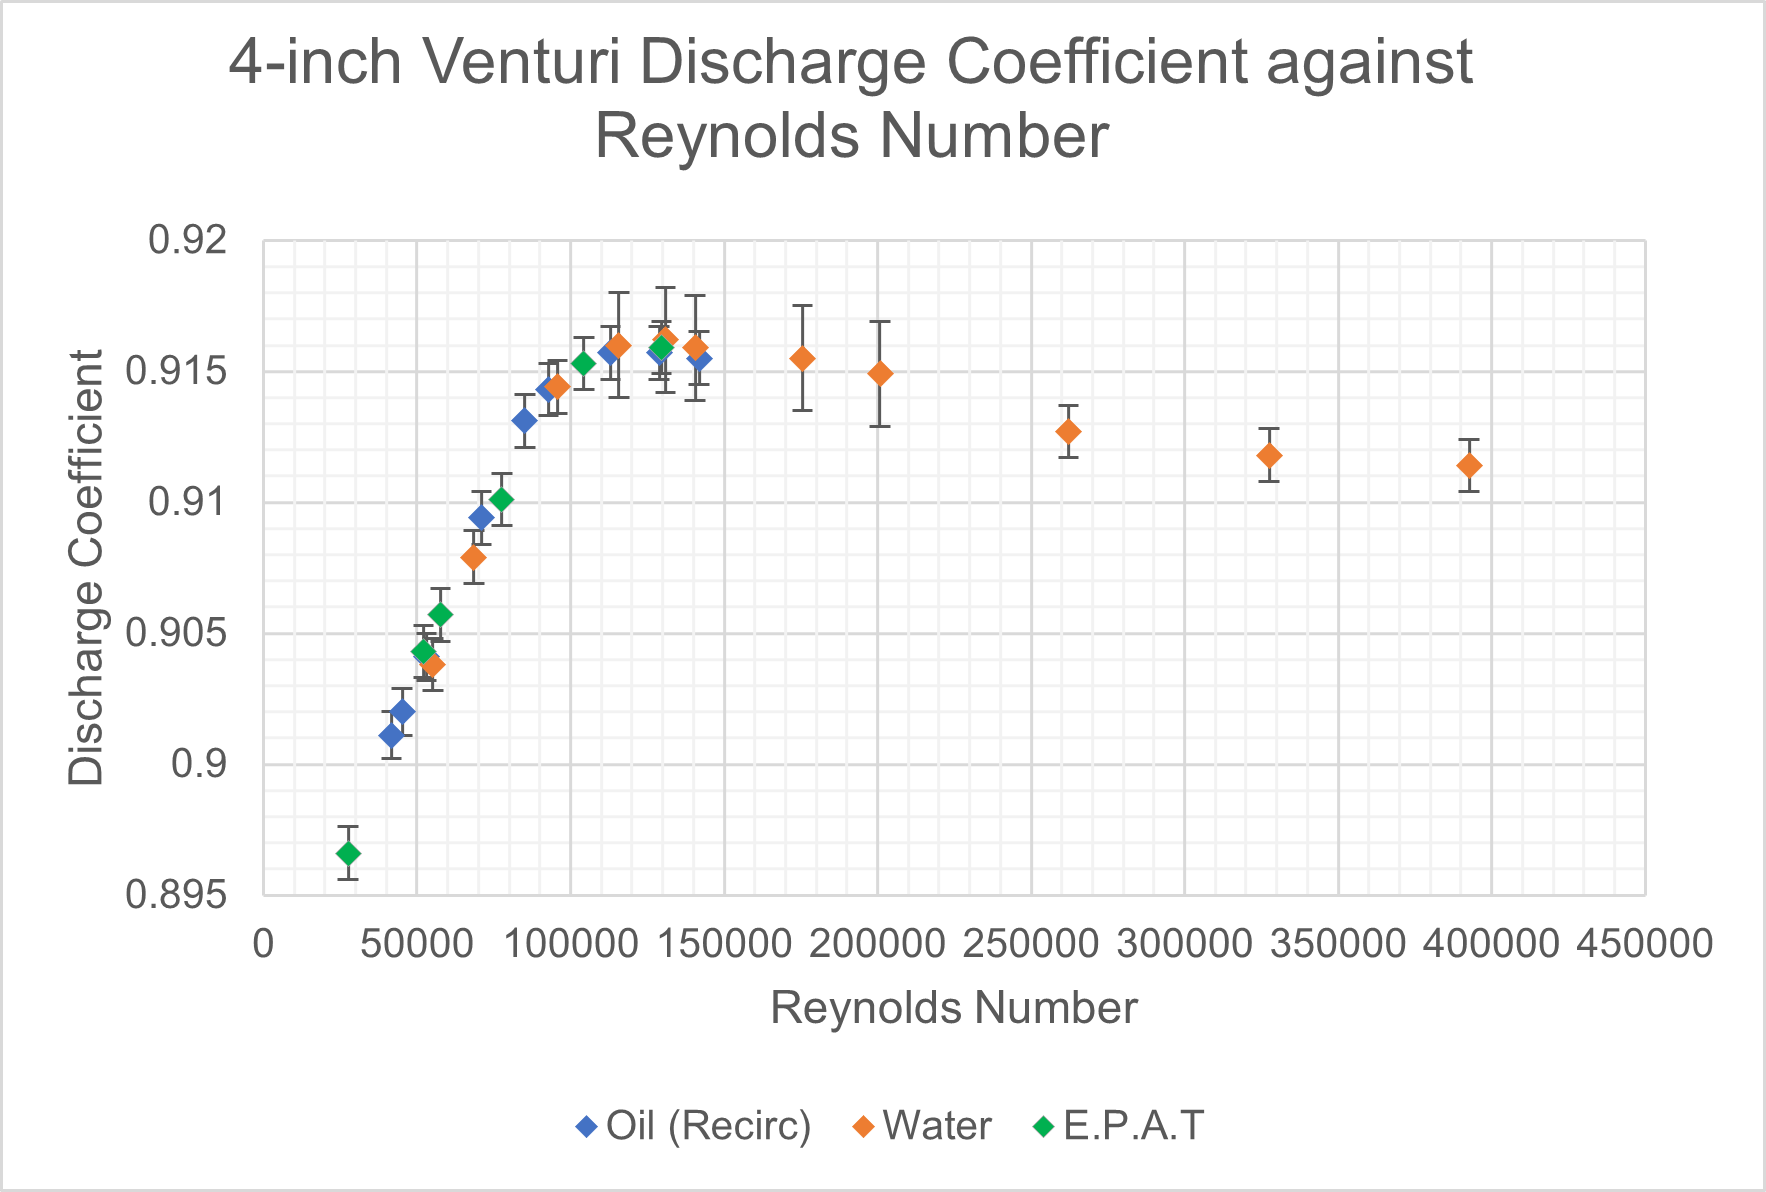
Figure 3: 4-inch Venturi Discharge Coefficient against Reynolds Number
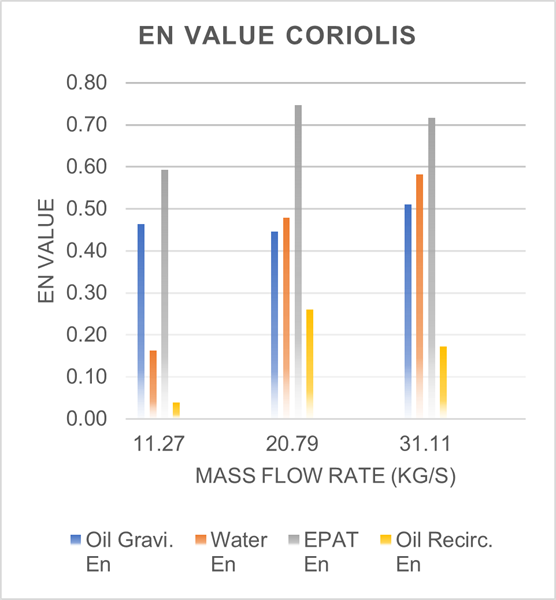
Figure 4: En Value for Coriolis Meter
From the results it can be concluded that TÜV SÜD’s Water Flow Facility, EPAT Facility and the National Standard Oil Flow Facility reference system are equivalent in terms of their reference measurements, and this validates the associated uncertainties reported for each facility. This is true for two different measurement technologies, differential pressure, and pulse output which adds further confidence to the results. The results are the foundation for the IS0 17025 accreditation held by TÜV SÜD National Engineering Laboratory [2].
This result and method give the industry confidence in both equipment calibration and flow measurement consultancy. Also, TÜV SÜD is leading by example in transparently sharing our approach to intra-comparison and results, to validate the stated calibration and measurement capabilities of the facility whilst committing to improve the global measurement system.
Jason Carr, Engineer
[1] C. Mills, “The Consistency of Pressure Effects Between DN80 Coriolis Flow Meters,” NEL Report Number 2019_565, 2019.
[2] United Kingdom Accreditation Service, “NEL Schedule of Accreditation,” [Online]. Available: https://www.ukas.com/download-schedule/0009/Calibration/ [Accessed 09-02-2024].
[3] M. Reader-Harris, Orifice Plates and Venturi Tubes, Switzerland: Springer, 2015.
[4] K. Beissner, “On a measure of constancy in comparison measurements,” vol. 39, no. 59-63, 2002.
[5] M. Cox, “The Evaluation of Key Comparison Data,” Metrologia, vol. 39, no. 6, p. 589, 2002.
[6] J. Wright, B. Toman, B. Mickan, G. Wubbeler and O. Bodnar, “Pass / Fail / Inconclusive Criteria for Inter‐Laboratory Comparisons,” in 9th International Symposium on Fluid Flow Measurement, Arlington, 2015.
[7] “The ISO Guide to the Expression of Uncertainty in Measurement (GUM),” ISO/IEC Guide 98, 1993.
[8] D. N. Glen, “DUT Repeatability and Uncertainty Overview, Internal Document FITR07200,” NEL, Glasgow, 2013.
Take a look at our flow measurement solutions or contact our flow measurement consultants to discuss your project. You may also be interested in our flow measurement training courses and don't forget to sign up for our emails for the latest flow measurement updates.


How can we ensure that measurements from instruments around the world can be meaningfully compared?
Learn More

Why density plays a crucial role in process control and reporting annual production
Learn More


Colin Lightbody, Principal Consultant at TÜV SÜD National Engineering Laboratory, discusses the challenges around accurate measurement and why measurement uncertainty is so important.
Read Article

Site Selector
Global
Americas
Asia
Europe
Middle East and Africa
